With UK gilt yields rising to the highest levels in more than 25 years, many LGPS investors are reconsidering long-dated fixed income assets. Nicolas Trindade senior portfolio manager at AXA IM examines why fixed income investors should be mindful of increased duration risks.
- We expect short-dated bonds to outperform long-dated ones in 2025
- We believe the UK yield curve should steepen in 2025 on the back of lower front-end yields while longer-term yields should remain anchored at higher levels
- Investors lengthening duration are not being compensated with nearly enough extra yield for the additional duration risk they are taking
- Short-dated corporate bonds should be an attractive option to consider for investors looking to diversify their cash or UK gilts holdings
We expect to see a strong steepening of the UK yield curve in 2025. At the front end of the curve, we believe yields will fall as the Bank of England cuts rates – we expect 75bps of cuts this year. At the longer end of the curve, meanwhile, we think yields will fall by much less, and may even rise.
Structural pressures from an ageing population, rising defence spending and the climate transition should lead to increased borrowing. We saw this in 2024 when medium and longer-dated maturities accounted for close to 60% of total gilt issuance, according to the Debt Management Office.
Yields at the longer end of the curve are essentially a representation of the expected path of short-term rates and a term premium, with the latter incorporating both growth and inflation risks. Term premia in the UK have been rising due to investor scepticism about the UK’s ability to manage its fiscal position.
The expectation is that chancellor Rachel Reeves will either have to raise taxes or reduce spending to remain within her fiscal framework, due to a combination of the high debt-to-GDP ratio, elevated interest rates and anaemic growth. Her autumn statement left just under £10bn of headroom, but most of this is likely to be wiped out in March due to rising yields and weaker growth. Raising taxes again could prove politically difficult in March, given that the chancellor has said the spring statement won’t be a major fiscal event; a reduction in spending is therefore more likely.
But pencilling in unspecified spending cuts in later years of the rolling window won’t sit well with bond markets. And furthermore, with the US likely to pursue inflationary policies under a Trump administration, we should see a sharp increase in term premia for US treasuries, also leading to an increase for UK gilts as both markets are highly correlated.
Where does this leave us? With higher expected government borrowing and increased term premia, due to both domestic and global factors. In this environment, it will be hard for longer-dated bonds to match the performance of short-dated bonds in 2025. Additionally, the short-dated bonds provide greater protection against a resurgence in inflation due to Trump’s inflationary policies linked to tax cuts, tariffs and immigration restrictions, increasing their appeal.
A lot more duration for not much more yield
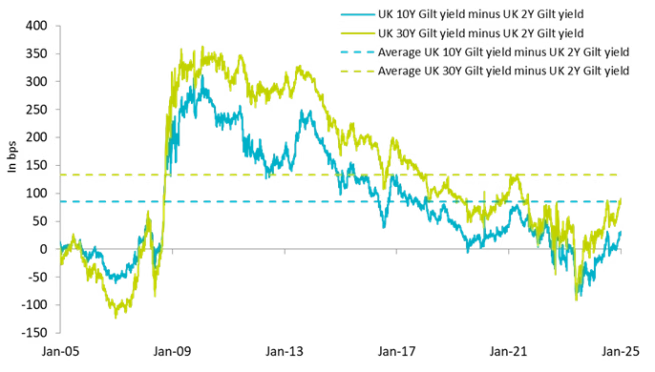
From an historical perspective, the longer end of the UK gilt yield curve does not look particularly attractive. The yield curve is only slightly upward sloping, with the difference between shorter and longer-dated yields remaining well below its long-term average, as illustrated below.
For instance, the UK 2Y gilt offers a yield of 4.2% with a duration of 1.9 years, resulting in a yield-to-duration ratio of 2.2. As investors extend their duration, this ratio decreases, even becoming less than 1.
The yield-to-duration ratio of the UK 10Y gilt – which has a yield of 4.5% for a duration of 7.7 years – is already below 1. With a yield of 5.1% and a duration of 15.7 years, the UK 30Y gilt has a ratio of just 0.3 unit of yield per unit of duration.
Stated more plainly, for a pick-up of 20% in yield between the 2Y and 30Y gilts, you take eight times more duration risk.
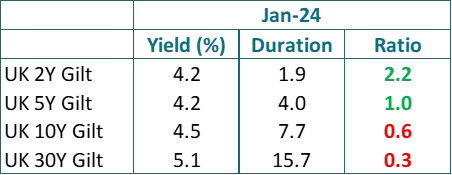
Therefore, investors lengthening duration are not being compensated with nearly enough extra yield for the additional duration risk, particularly in an environment where inflation has proven to be much stickier than expected.
Higher duration does not mean higher returns
As illustrated below, short-dated gilts have significantly outperformed their all-maturity counterparts, particularly since the UK mini budget in September 2022. Short-dated gilts have provided downside mitigation during central banks hikes, but also better returns since the beginning of the monetary easing cycle.
We expect this trend to continue as falling front-end gilt yields should support short-dated assets, while long-term pressures are likely to cause headwinds to the performance of longer-dated assets.
Investors may also want to consider short-dated corporate bonds as a way to benefit from an additional pick-up in yield when compared to short-dated gilts. The AXA Sterling Credit Short Duration Bond Fund could be an attractive alternative, as this conservative and actively managed strategy has a significant emphasis on strong risk-adjusted returns by minimising drawdowns.
As illustrated below, the AXA Sterling Credit Short Duration Bond Fund has a longstanding and proven track record of reducing the impact of drawdowns, especially in 2022 when fixed-income markets experienced their worst year in a generation.
Over the last 10 years, the Fund is up +20% (Z Acc share class, cumulative performance, net of fees). It has substantially outperformed the short-dated and all-maturity gilt indices – by c.14% and c.30%, respectively – with lower drawdowns, and lower volatility than the short-dated gilt index over the long term.
This demonstrates that the Fund’s active management and conservative approach has provided attractive risk-adjusted returns over time and should be a very attractive option to consider for investors looking to diversify their cash or UK gilts holdings.
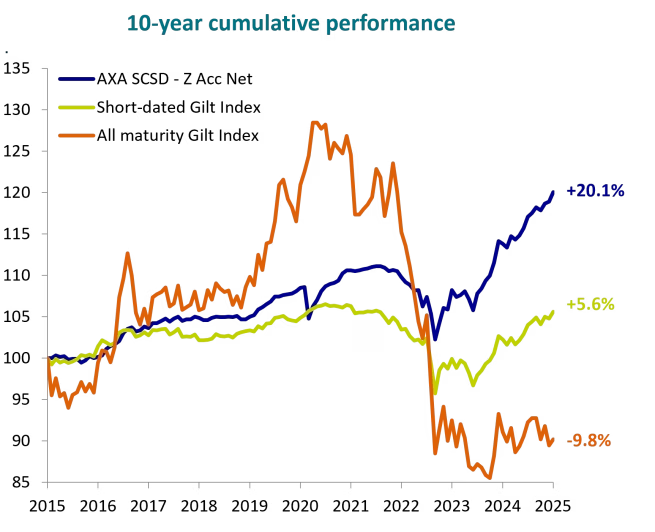


Source: AXA IM as at 31 January 2025. AXA SCSD stands for AXA Sterling Credit Short Duration Bond Fund. Performance is presented net of ongoing charges (40 basis points) and gross of tax, and is calculated using mid prices for the Z (G) Acc share class (income reinvested) since its launch in November 2010. Past performance is not a guide to future performance. Return may increase or decrease as a result of currency fluctuations. Cash deposits are guaranteed while all investments involve risks. Investments can go up or down and you may not get back the original amount invested. Historical volatility is calculated using 1-year rolling weekly returns over the last 10 years. Drawdowns are calculated, using historical monthly returns.